The author of this map is Alasdair Rae, founder of Automatic Knowledge, a website for creating and learning about data analysis in a spatial context.
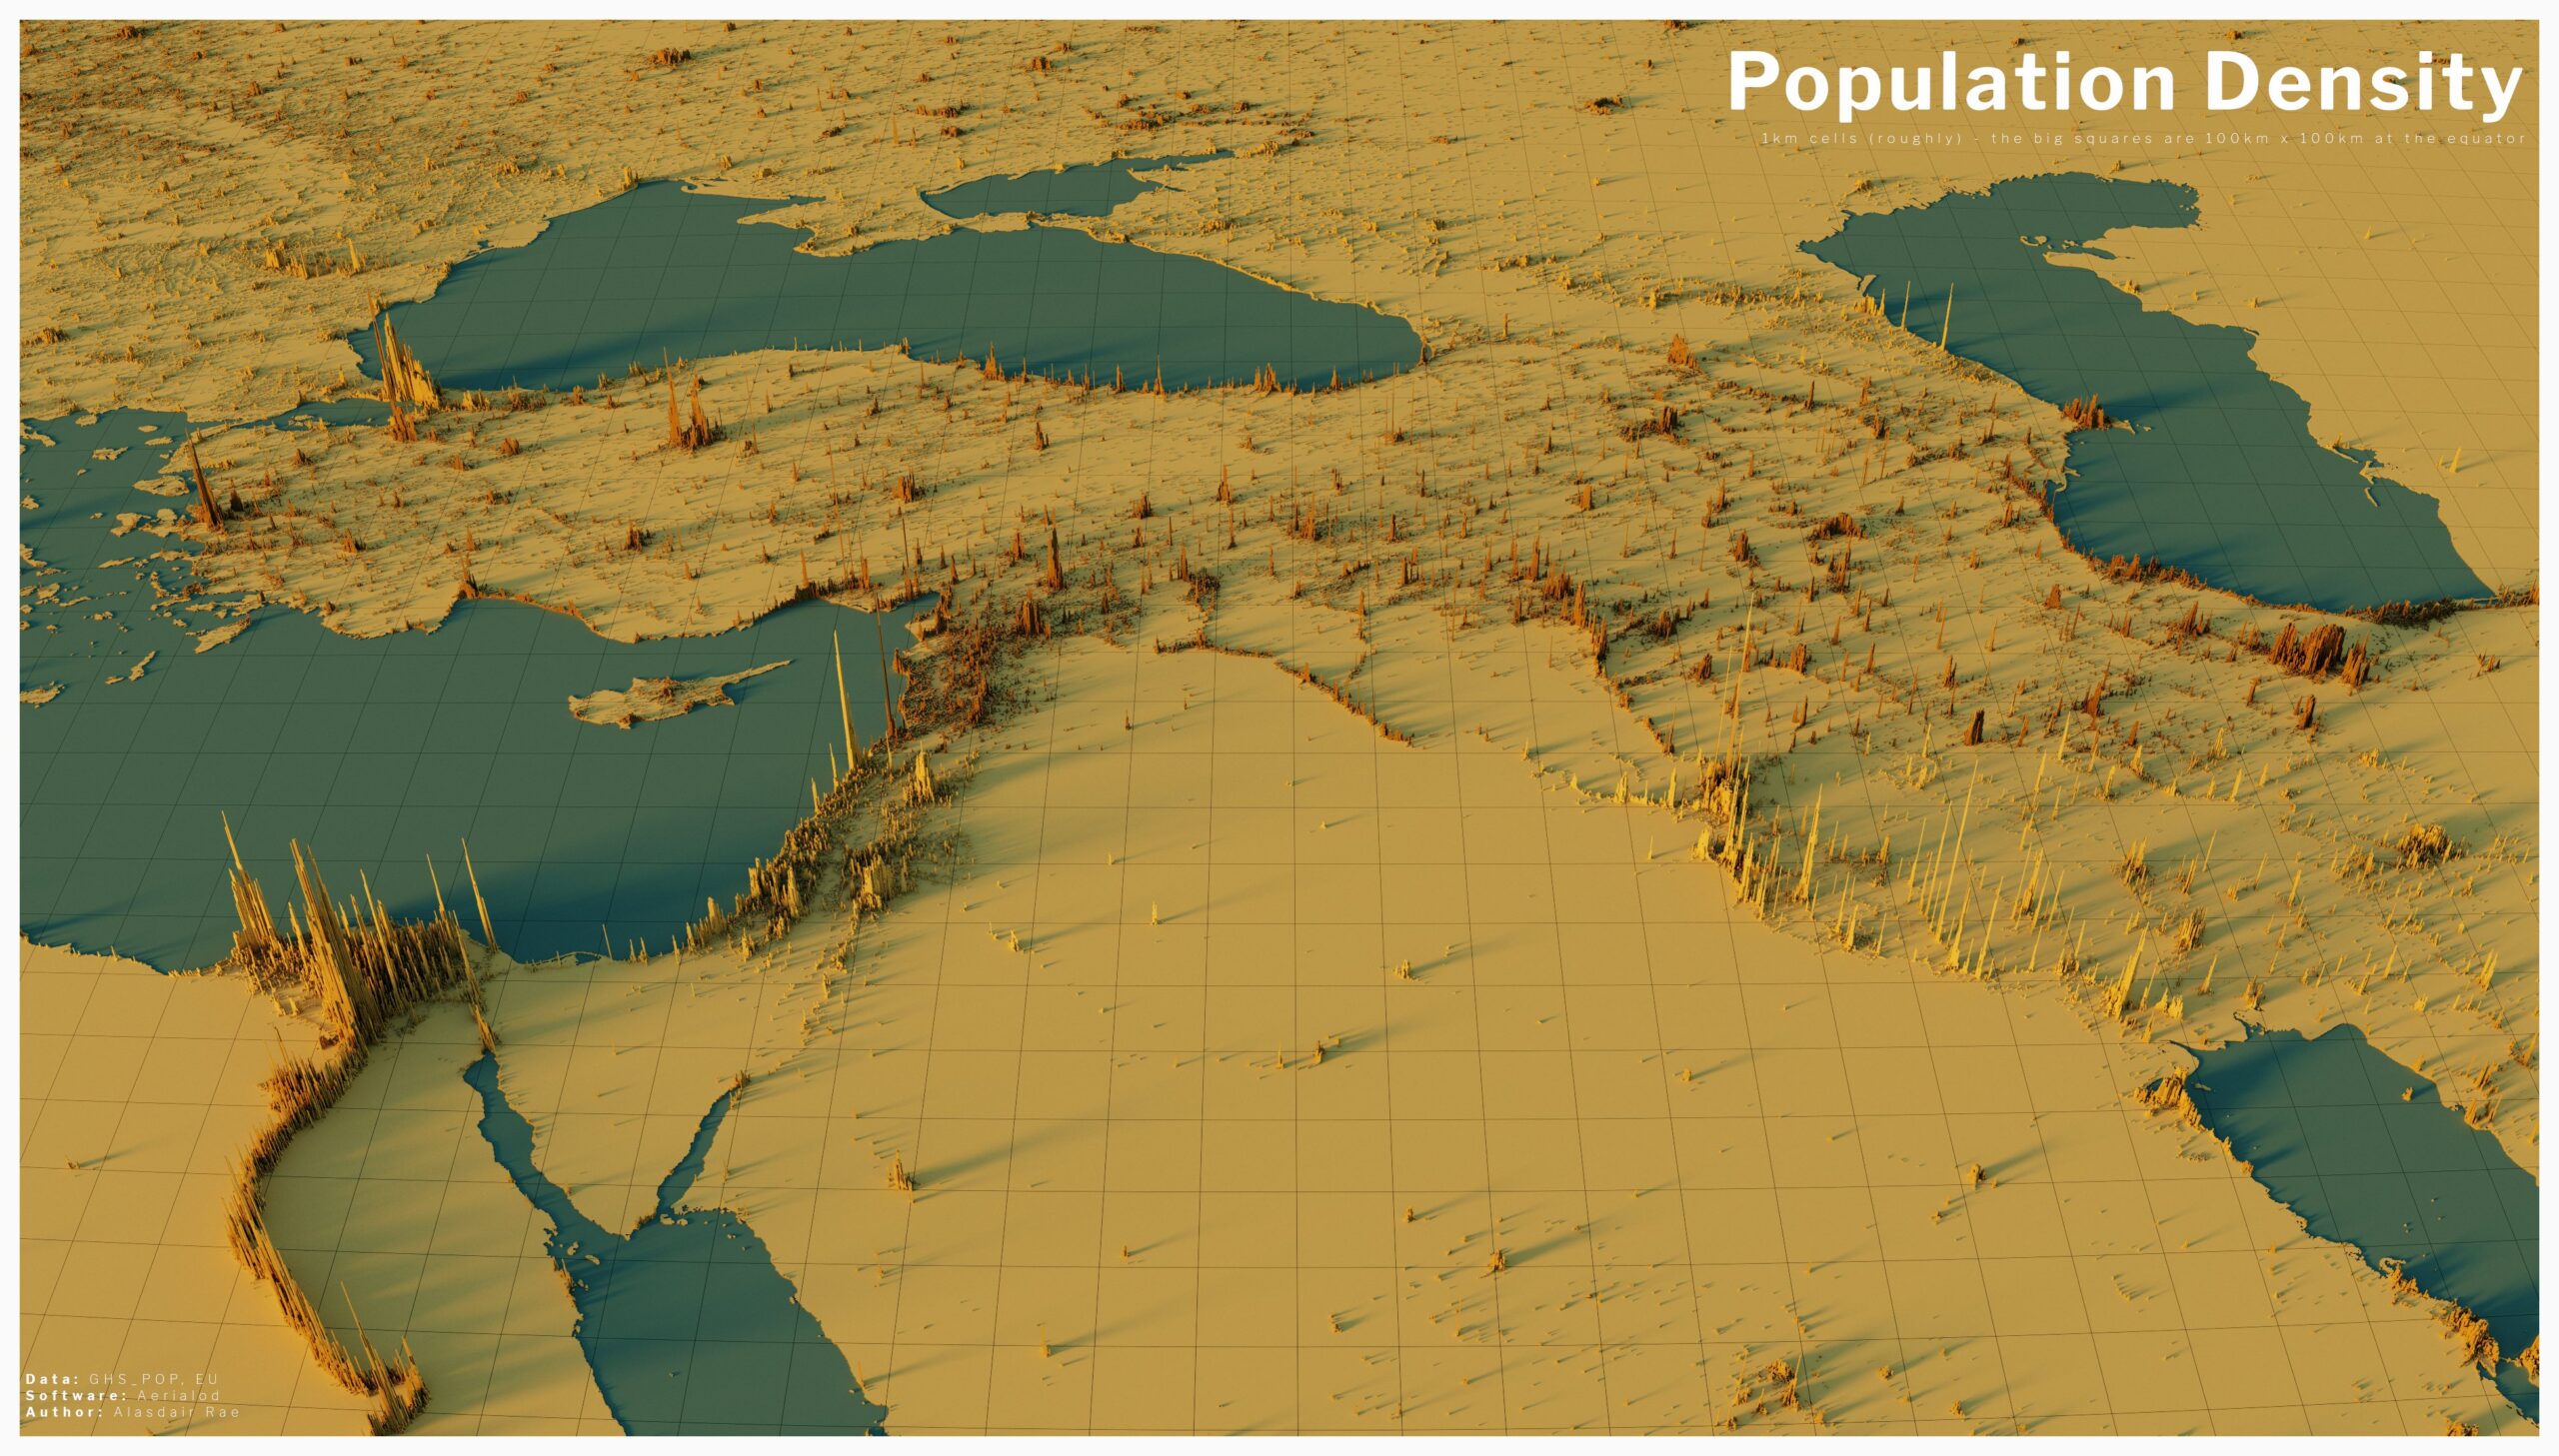
This particular map shows the population density in the Middle East. To do this, the author represents the map in 50 x 50 kilometre grids (visible on the map), and within each grid he takes small 1 x 1 kilometre grids. In each square kilometre, he draws a line equivalent to the population density at that point, so that large agglomerations are represented as mountainous areas.
Egypt stands out, with the entire course of the Nile clearly visible, as well as the large population agglomeration at its mouth. The course of the Euphrates and Tigris rivers can also be inferred along Syria and Iraq, with their mouths in the Persian Gulf. Along the coast, the large urban agglomeration in the Mediterranean Levant stands out, with the most populated cities in Israel, Lebanon, Syria and Jordan.,
Sources

