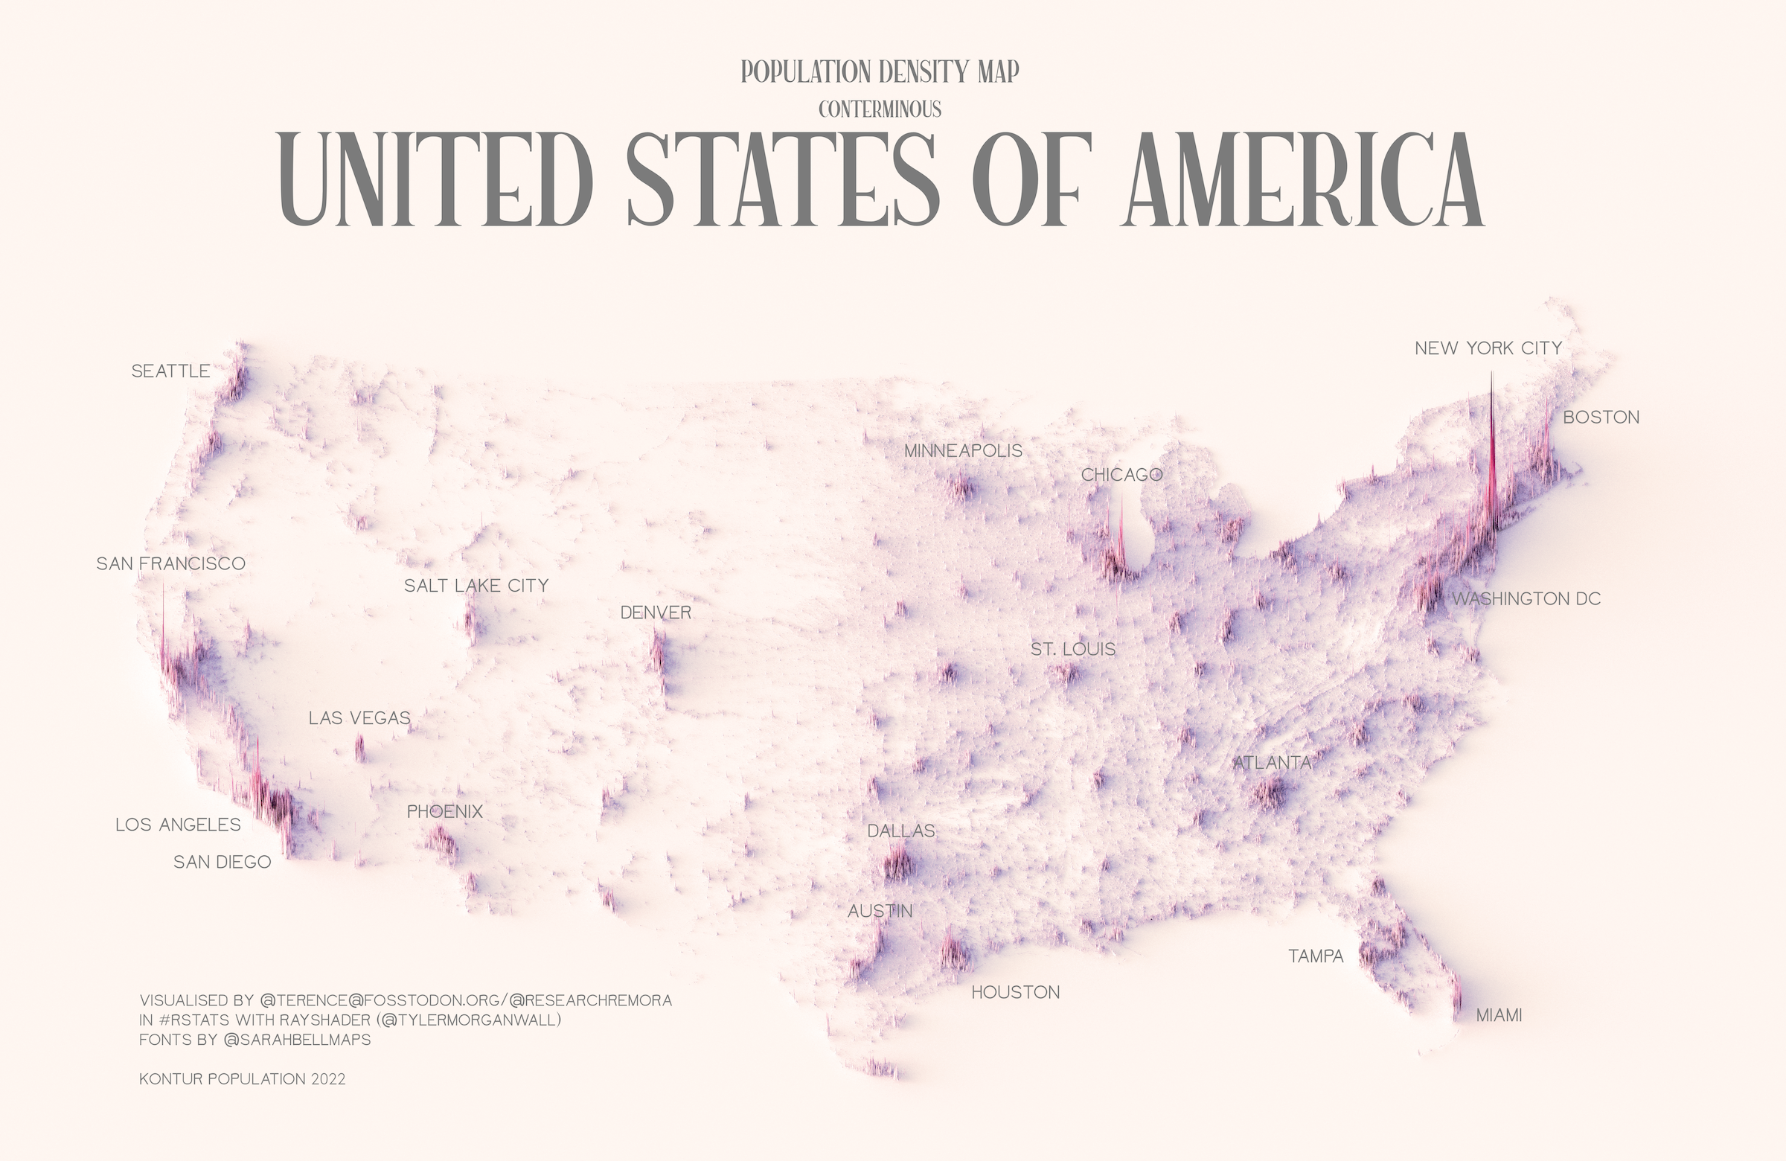
This illustration, created by Terence Teo, represents the population density of the contiguous United States on a three-dimensional map. To do this, Terence extracted the data available at Kontur Population with which it generates columns using a programme, with a height that represents the population density at each point.
This map quickly shows that the entire eastern region of the United States has a higher population density than the western region. Clearly, the largest concentration of population is located in the Northeast Corridor, also known as BosWash, which encompasses all urban areas between Boston and Washington, D.C., with nearly one-sixth of the country's population.
Sources


 Español
 English (UK)