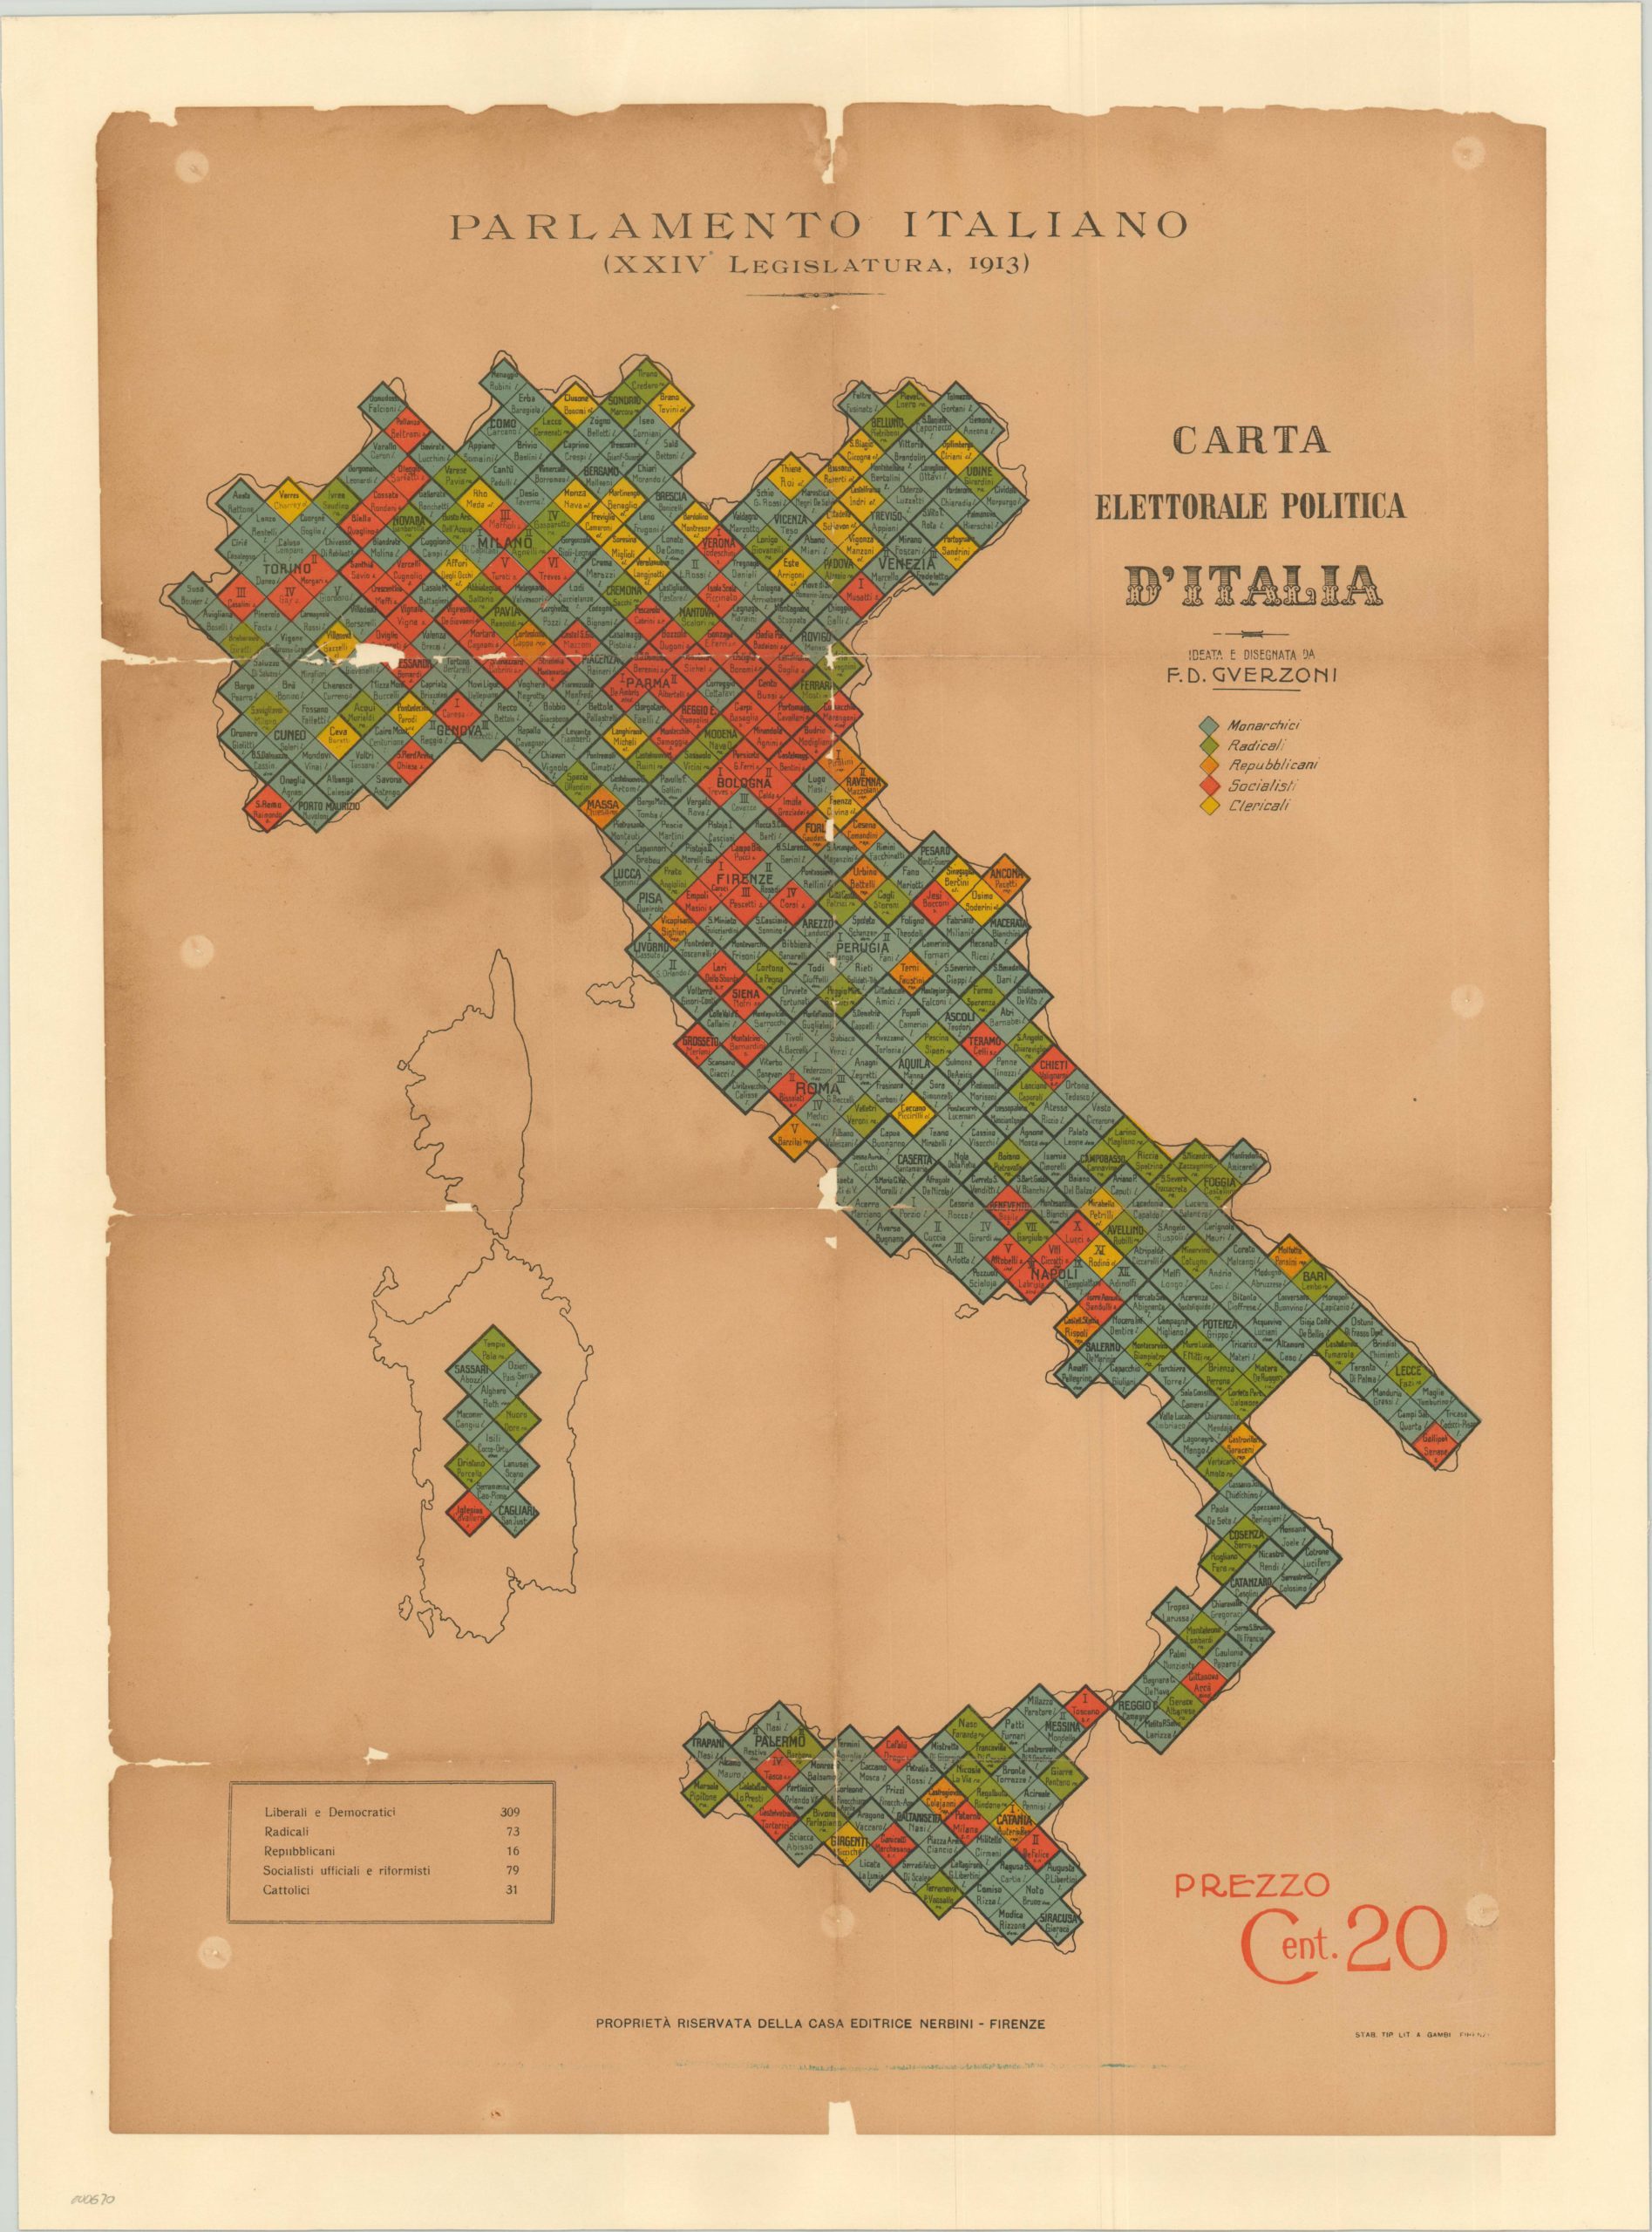
This map was created by F. D. Guerzoni and published by Nerbini in 1913. The purpose of this copy was to show ordinary citizens the results of the Italian general election held on 2 November of that same year.
To do this, Guerzoni chooses to draw all the districts on the map of Italy in squares of equal size, each painted in a colour representing the ideology of the different parties:
- Blue (309): Monarchist parties (liberal and democratic).
- Green (73): Radical parties.
- Orange (16): Republican parties.
- Red (79): Socialist parties.
- Yellow (31): Catholic parties.
The elections were won by the Liberal Union, a coalition that brought together most of the liberal parties on the left and right, with 270 representatives and an absolute majority.
Sources

