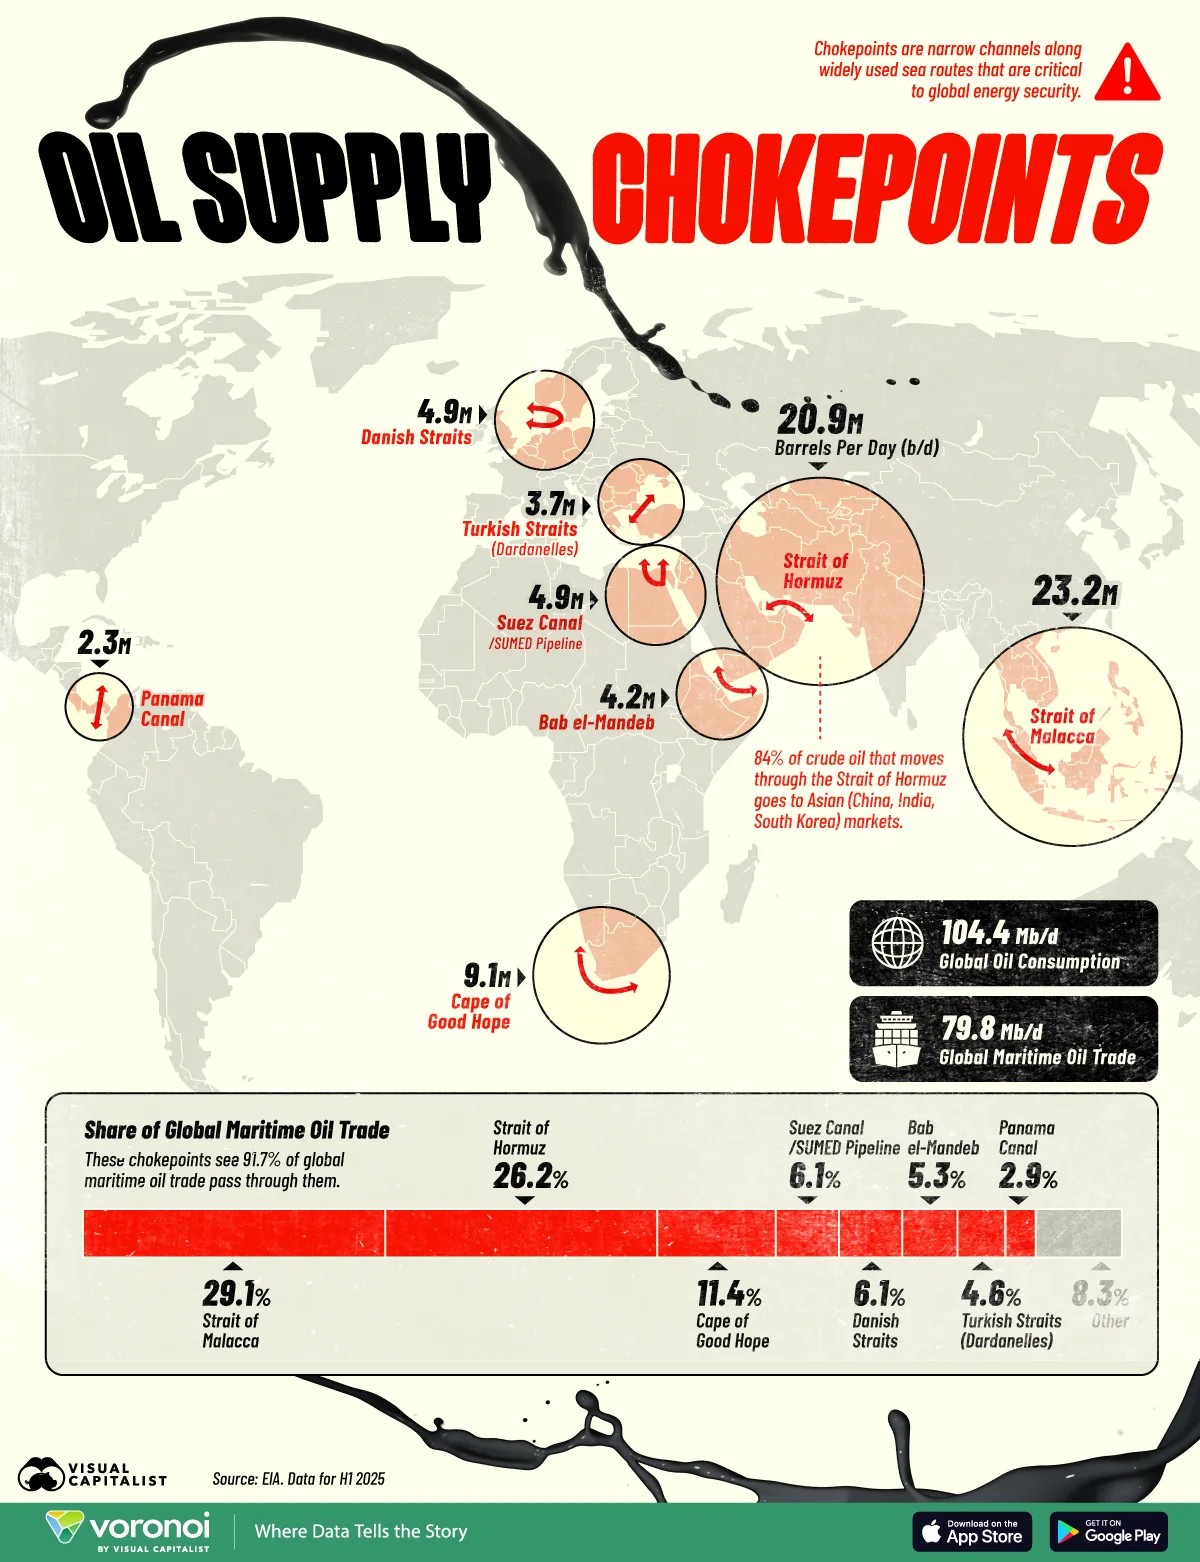
This map, published in Visual Capitalist in 2026, shows the main bottlenecks in seaborne oil trade, according to data published by the US Energy Information Agency (EIA) for the first half of 2025.
Each of these passages (channels, straits and headlands) is represented by a circle of different size, depending on the millions of barrels passing through each day (mb/d). The eight points shown in the infographic together account for more than 90 % of the world's seaborne trade. From highest to lowest volume, these are the most critical points on the planet:
- Malacca Strait (23.2 mb/d, a 29.1 %)
- Strait of Hormuz (20.9 mb/d, a 26.2 %)
- Cape of Good Hope (9.1 mb/d, an 11.4 %)
- Danish straits (4.9 mb/d, a 6.1 %)
- Suez Canal and SUMED pipeline (4.9 mb/d, a 6.1 %)
- Bab el-Mandeb Strait (4.2 mb/d, a 5.3 %)
- Dardanelles Straits (3,7 mb/d, a 4,6 %)
- Panama Canal (2.3 mb/d, a 2.9 %)
The high traffic at the Cape of Good Hope in southern Africa reflects how this alternative route has become more prevalent due to the instability of the Red Sea since 2024, caused by the war in Yemen.
Sources

