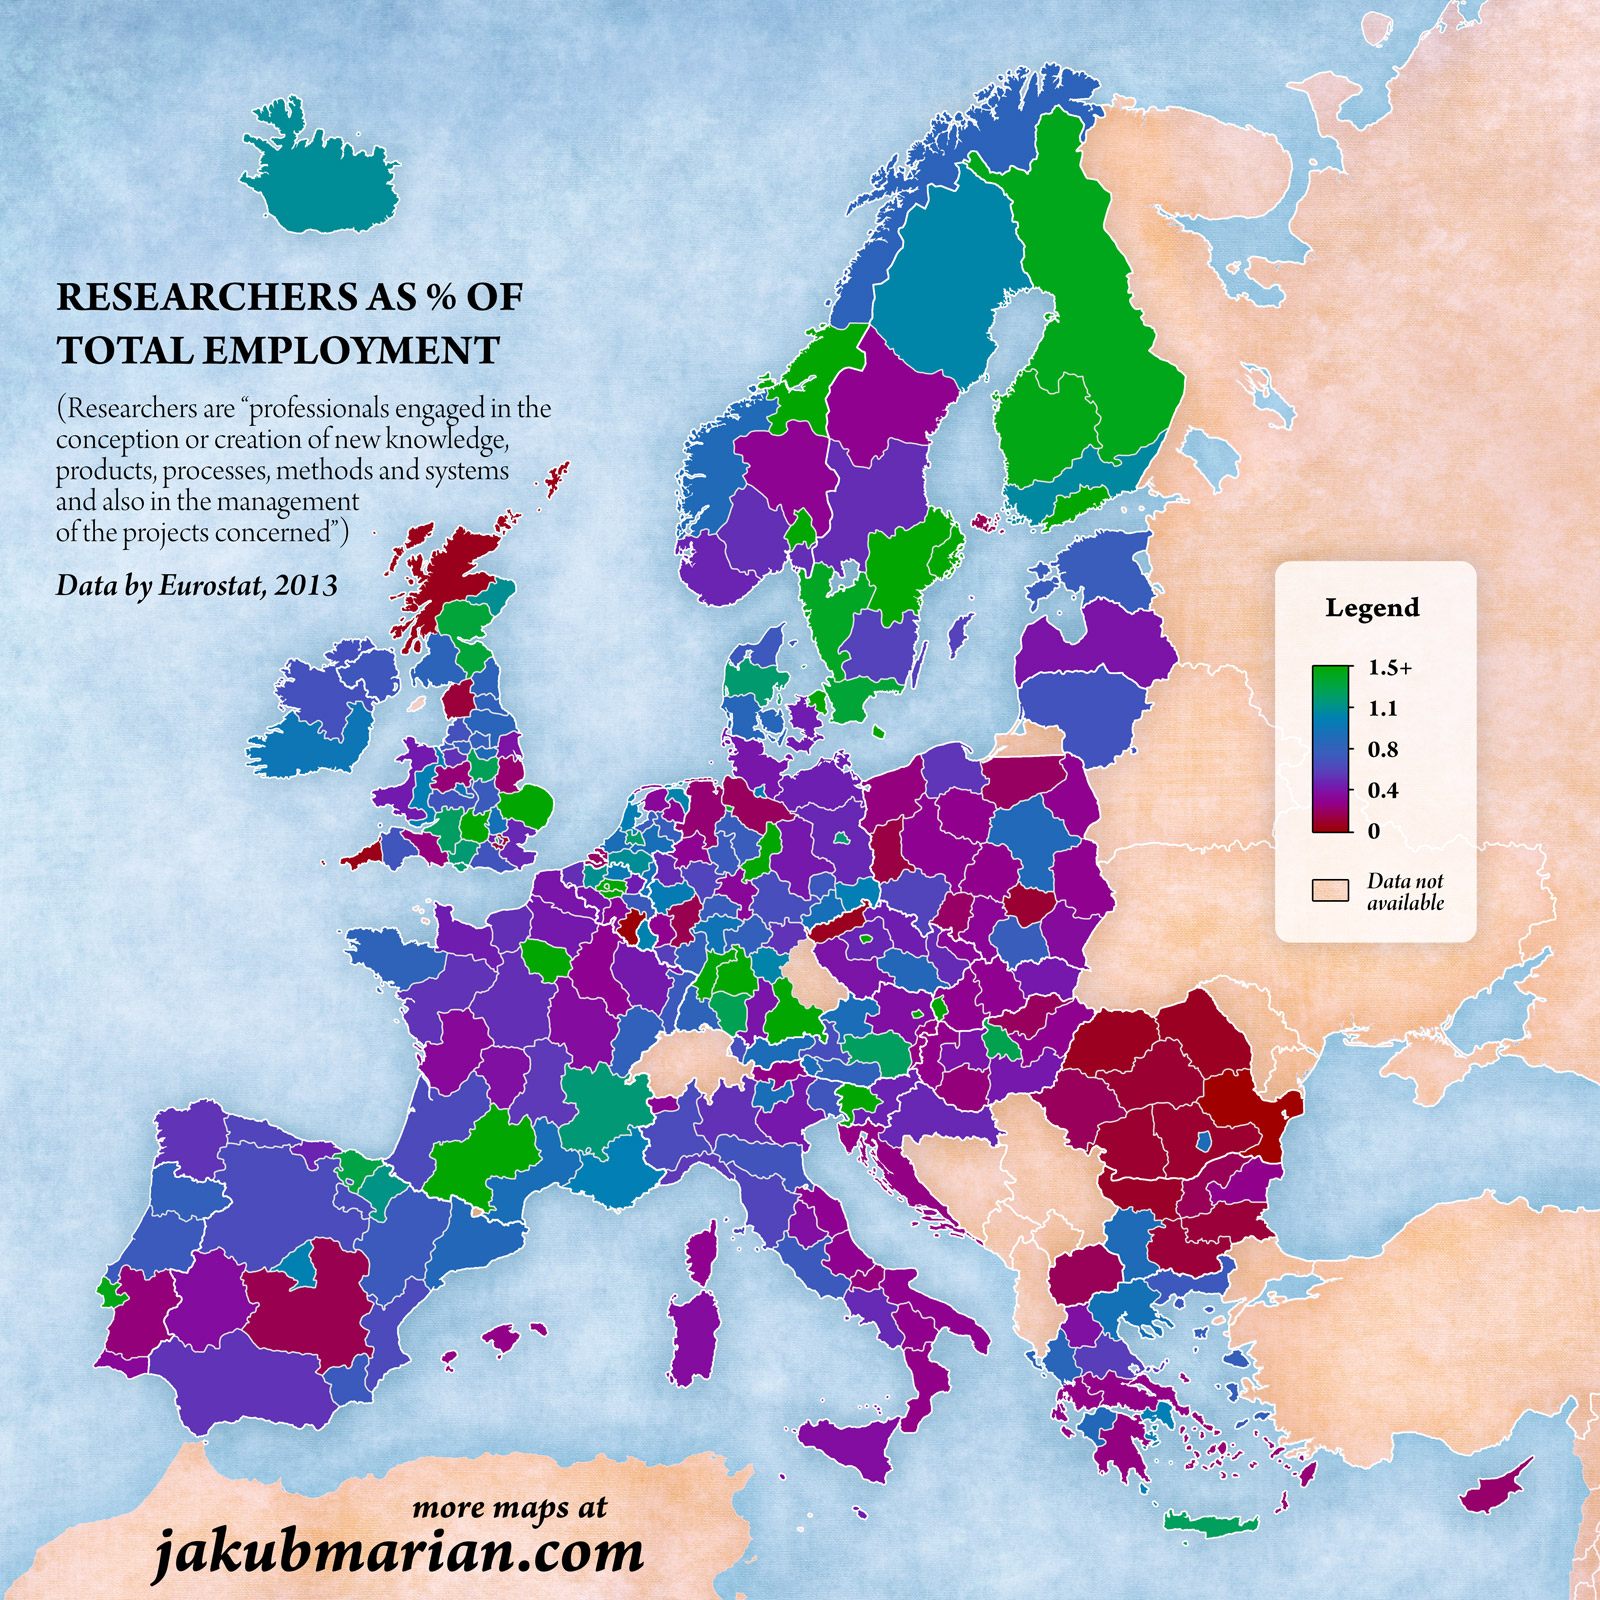
This map, created by the illustrator Jakub Marian, shows the percentage of workers engaged in research in each region of the European Union, Norway, and Iceland. The data used by the author is obtained from Eurostat 2013.
The description of research workers includes all those engaged in the conception or creation of new knowledge, products, processes, methods, or systems. It also takes into account all management positions associated with research projects.
The different colours show the highest percentages (in blue and green) and the lowest percentages (in purple and red). These are the regions of the European Union with the highest percentages in 2013:
- London (United Kingdom), with 5.21 TP3T.
- Copenhagen (Denmark), with 2.81 TP3T.
- Walloon Brabant (Belgium), with 2.8%.
- Bratislava (Slovakia), with 2.41 TP3T.
- Uusimaa (Finland), with 2.2%.
- Trøndelag (Norway), with 2.21 TP3T.
- Prague (Czech Republic), with 2.1%.
- Lower Saxony (Germany), with 2.11 TP3T.
- Isle-de-France (France), with 2.0%.
Sources

