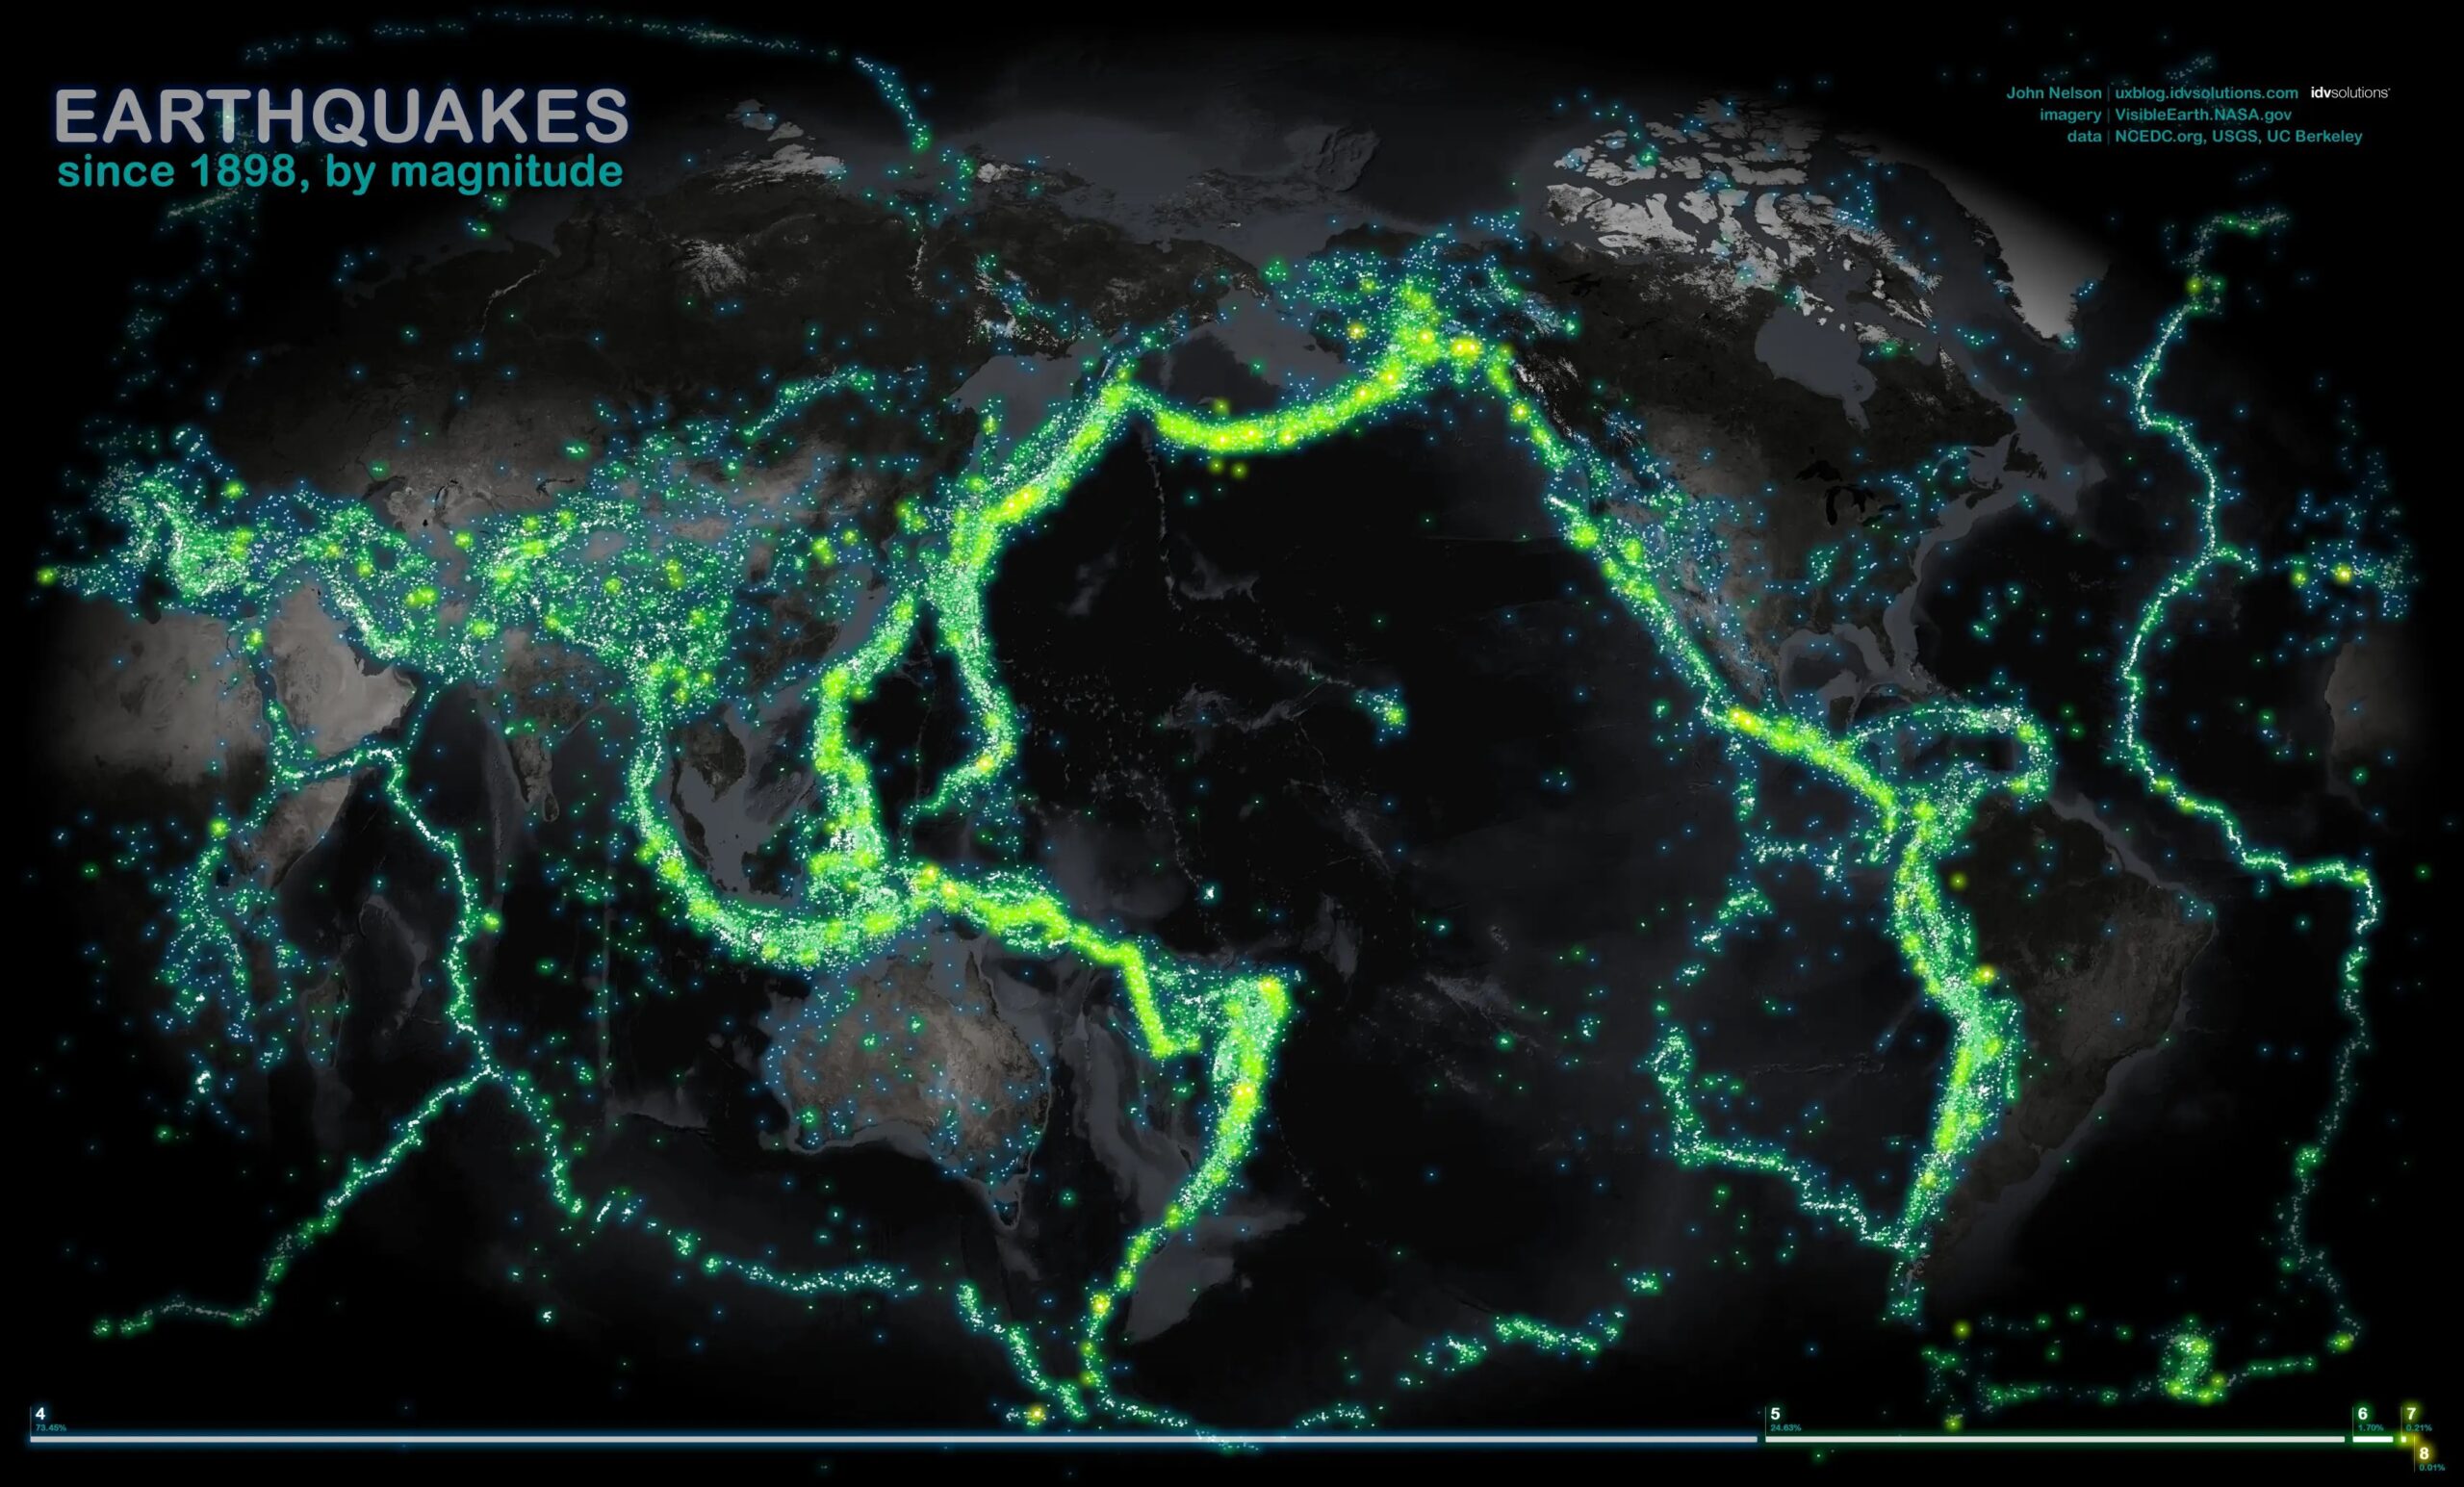
This map, created by John Nelson for IDV Solutions in 2012, shows all earthquakes recorded worldwide since 1898, using data from the NCEDC (Northern California Earthquake Data Centre).
For the representation, the author has chosen different colours depending on the magnitude of the earthquakes, highlighting those with a magnitude above 7 with a green halo and those with a magnitude above 8 with a yellow halo.
When observing all this aggregated data, it is easy to establish a correlation between this map, the map of Earth's tectonic plates and a map with all the active volcanoes in the last 10,000 years.
Sources

