This map was published Erwan Rivault in 2023 as part of the initiative #30DayMapChallenge.
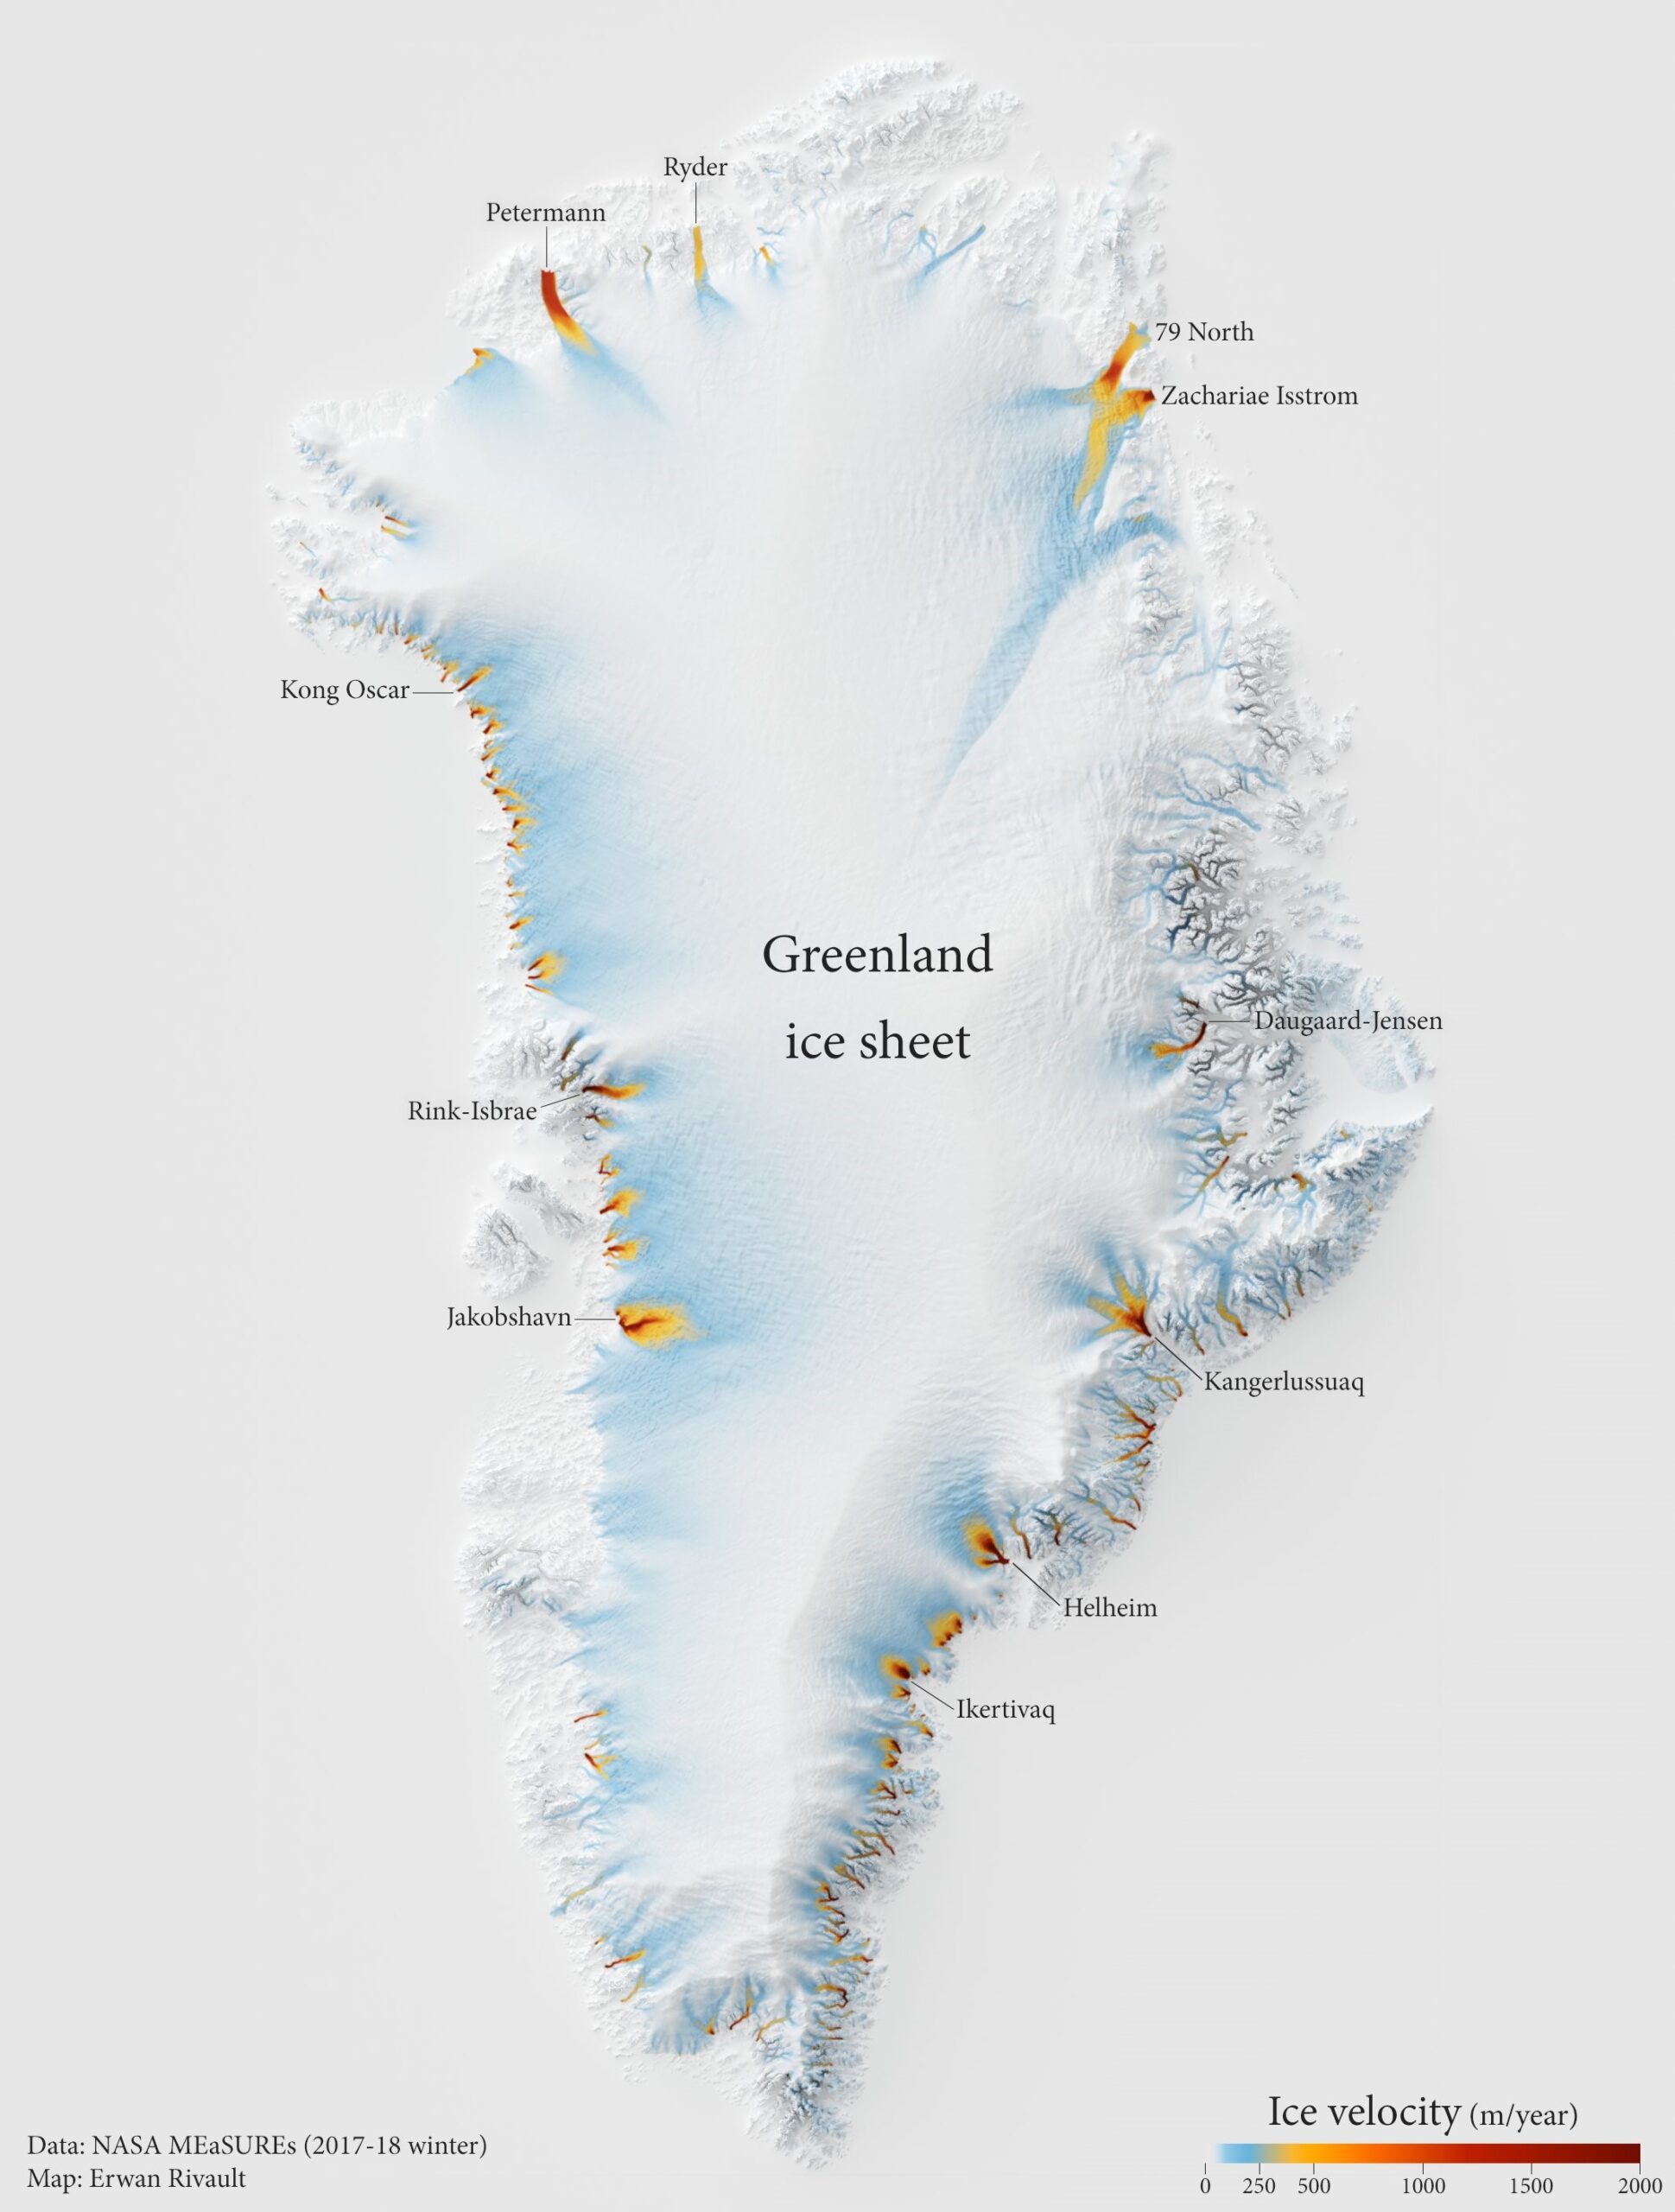
This illustration shows the movements of the large ice sheet in Greenland. The different colours show the speed at which the ice moves at each point in metres per year, according to NASA data collected in the winter of 2017–2018. The areas with the highest speeds, shown in red (up to 2,000 metres per year), correspond to the island's most important glacier tongues, such as Petermann, Jakobshavn and Zachariae.
You can find more information about the initiative here. #30DayMapChallenge in what I wrote in the newsletter.
Sources

