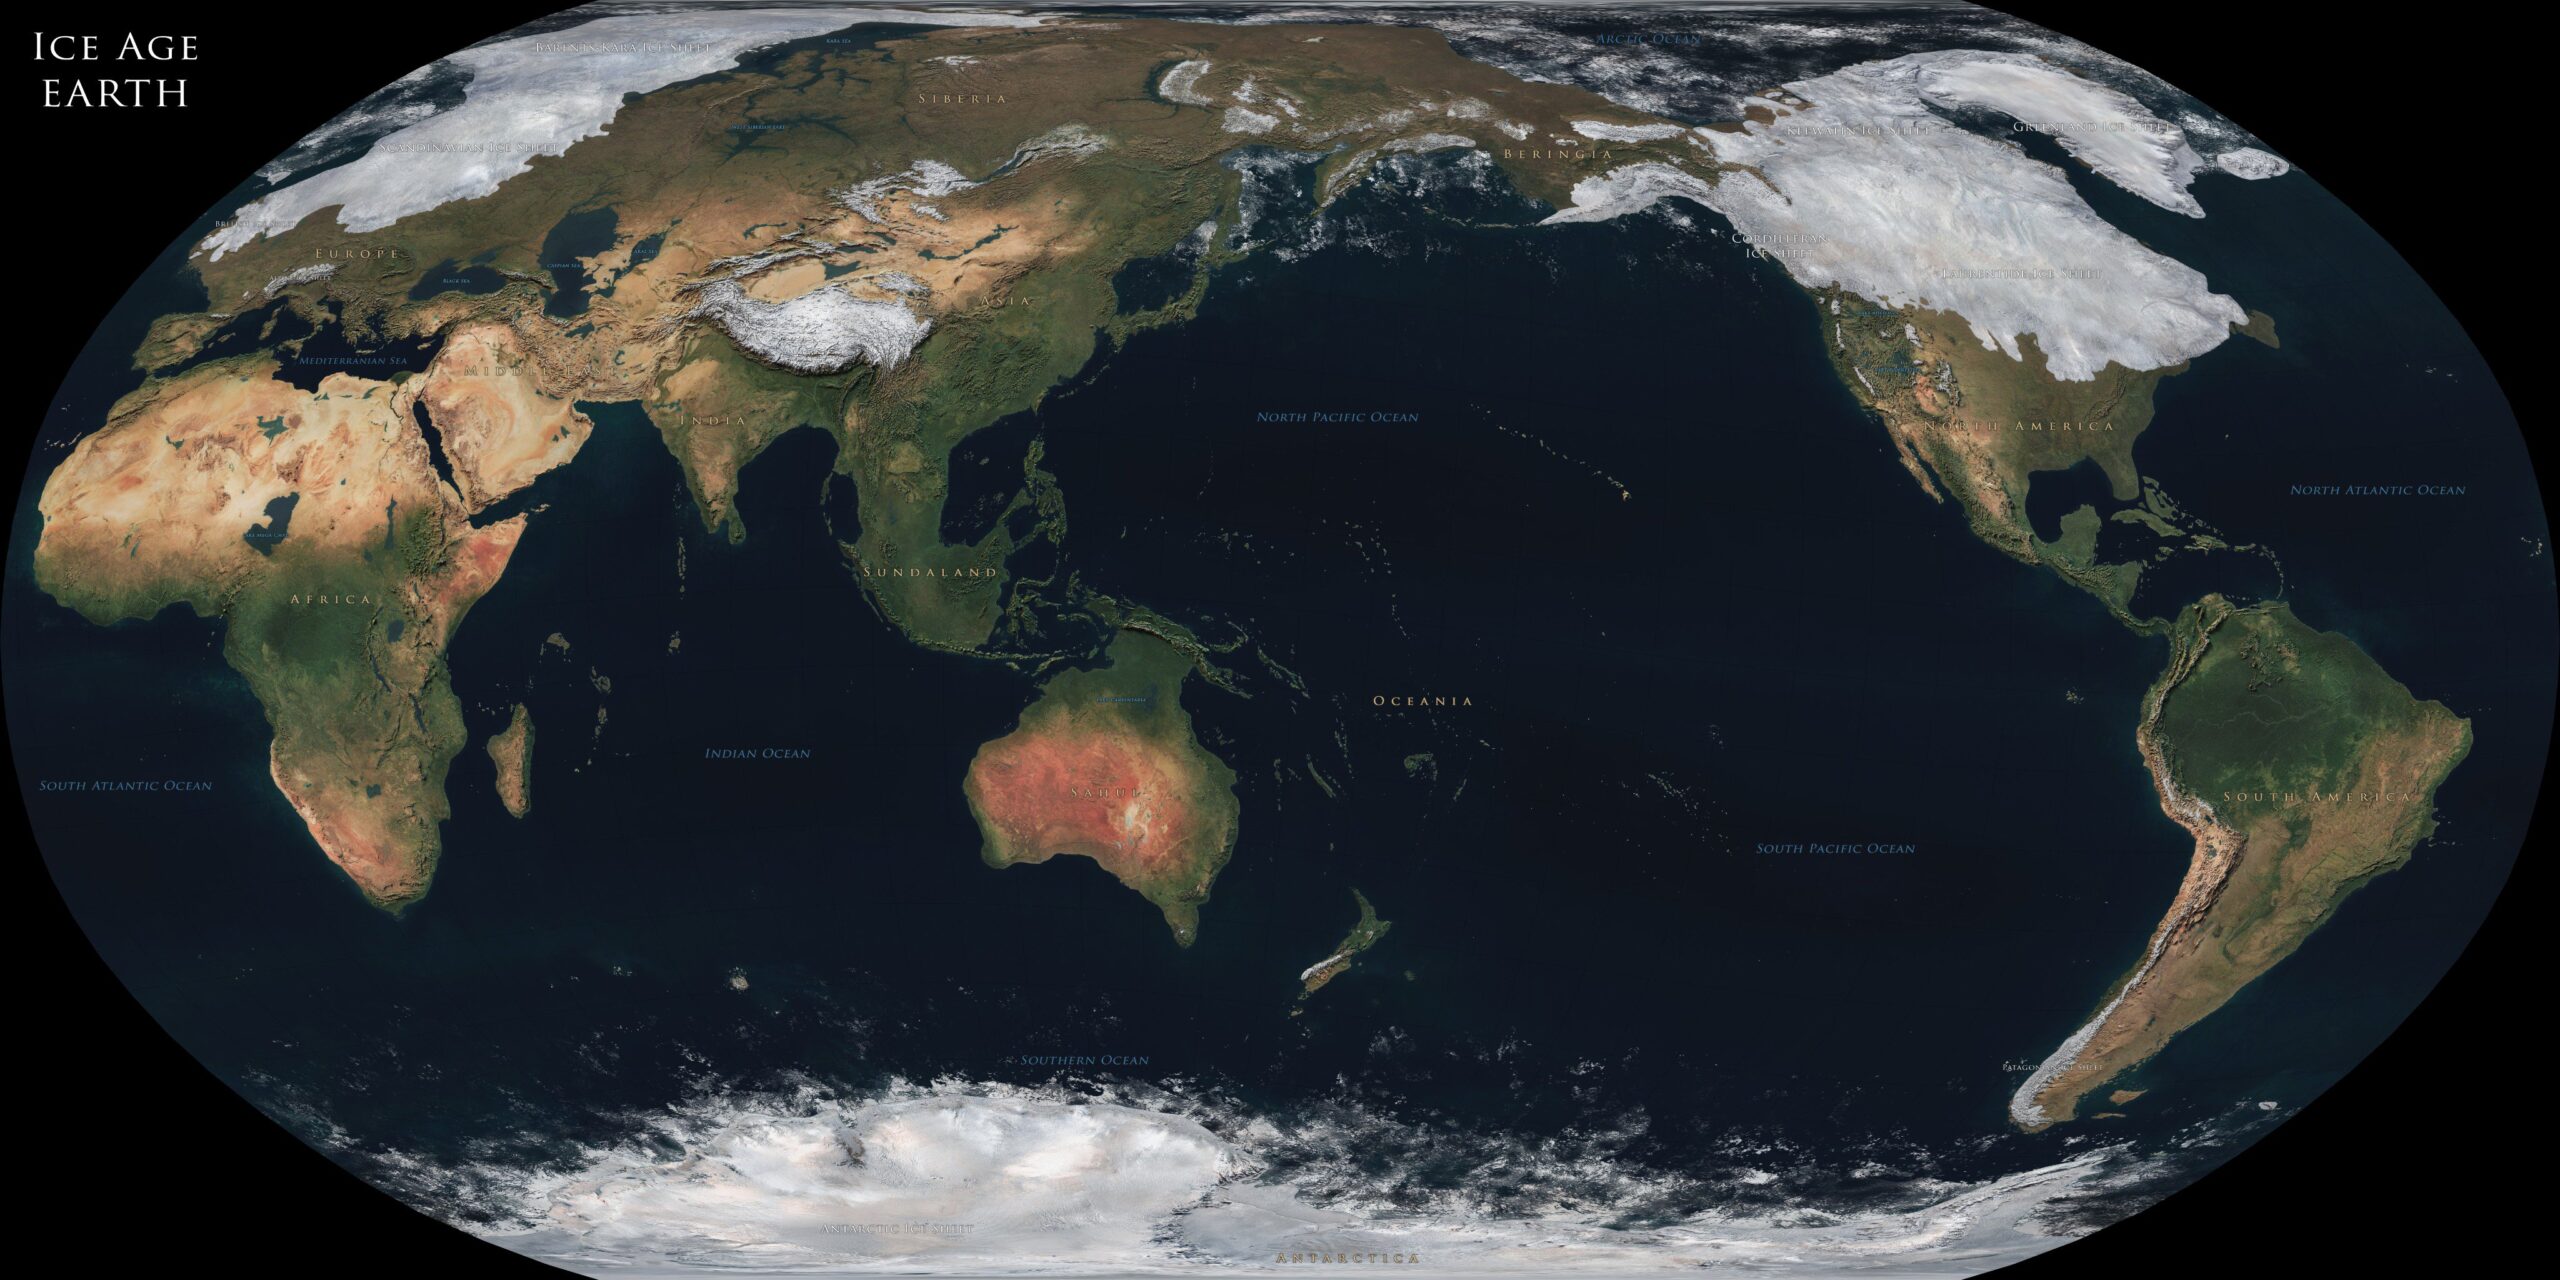
This map, created by Atlas V7X shows the extent of glaciers during the Ice Age, as well as the outline of the coastlines.
The last ice age (Würm glaciation in Europe, Wisconsin glaciation in America) occurred approximately between 110,000 and 10,000 BC. The global average temperature was between 4 °C and 5 °C below the 20th century average temperature. During the peak, towards the end of the glaciation, sea level reached between 100 metres and 120 metres above present-day sea level.
This illustration shows the notable differences that existed compared to today:
- Europe was largely covered in ice, beneath which were the lands known as Doggerland.
- Europe and Africa were almost connected by Gibraltar and Sicily, although the Mediterranean Sea never became isolated, as the Black Sea did.
- There were many periglacial lakes (supplied by glacial melt). The largest is estimated to have been Lake Mansiyskoe, which was twice the size of the Caspian Sea today.
- In Africa there was still the Mega-Chad Lake, which grew to 400,000 km².
- The Bering Strait was connected by Beringia.
- North America was also largely covered in ice.
- In Southeast Asia, there were two large regions that practically connected the Asian continent with Australia: Sundaland and Sahul.
Here you can read more about lands emerged during the last glacial peak.
Sources

