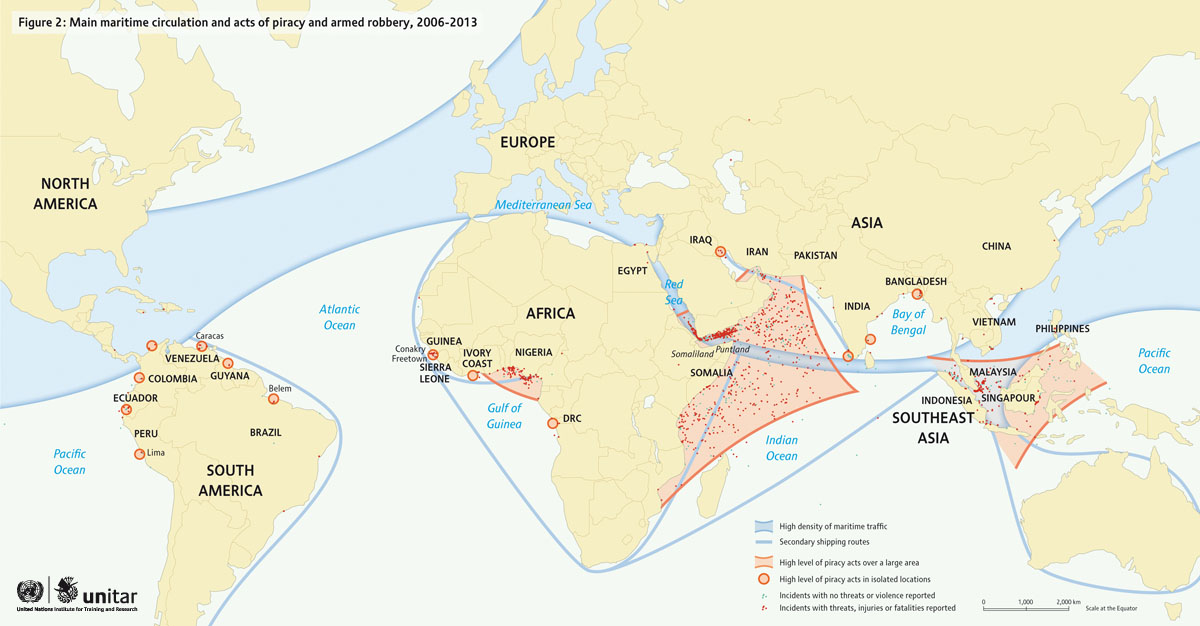
This map, produced in 2013 by UNITAR, the United Nations Institute for Training and Research, shows the state of maritime piracy around the world.
To this end, the map shows all incidents reported between 2006 and 2013. The red dots represent events that were accompanied by threats or damage of any kind. The blue dots, on the other hand, represent events in which there was no violence. This makes it possible to identify the areas where piracy is most prevalent, marked in red on the map:
- The western Indian Ocean, with particular intensity in the Gulf of Aden.
- The Gulf of Guinea, off the coast of Nigeria.
- The Strait of Malacca and, more broadly, much of the seas of Indonesia.
The illustration also shows, marked in blue, the areas used by the main trade routes between Europe and North America, between North America and China, and between Southeast Asia and the Mediterranean Sea.
Sources

